Galactic Observations

by Jackson Novak

Screen Shot 2018-08-15 at 6.25.15 PM.png

While working on our last project for the Citizen Science Ambassador project, there were many emotions, ranging from happiness, to sadness. Happiness from creating an amazing project and being able to share it with experienced people, and sadness because it was our last project together because the program was ending. I am proud of the work my group created and feel we did a great job presenting our project to a group of Adler professionals. We had much information to deal with and I think we did exceptionally well at being efficient with our work and communicating well with each other and our peers.

To begin, we explored data from a project called galaxy zoo, which allows anyone to classify the plethora of galaxies they have photographs of from the Sloan Digital Sky Survey. During the process of classifying the galaxies, the participator of the survey would look at the photograph and decide if the galaxy was a spiral galaxy or elliptical galaxy. While looking at this data, our team decided to focus on local density of the galaxy.  This is how many nearby galaxies there are in a certain radius and the logged mass of the galaxy (which is the recorded mass of a galaxy). After we collected this data we filtered it to only show galaxies that were 80% certainly a spiral or elliptical. We put the rest of the galaxies into a neither column. Our research question was: Are ellipticals or spirals closer to other galaxies? The hypothesis was: Spiral galaxies are closer to other galaxies because they take up more space in between galaxies than ellipticals.                

Important to realize, when dividing our work among each other, we learned about each of our interests and what subjects we were very strong in and could be the most efficient. I found myself taking on the role of collecting the data for everyone to sort through, while Victoria organized the presentation, and Liz categorized the data and created a color scheme for the slides. A problem we faced was making sure everyone was on the same page, because I missed a day when the rest of the team was collecting data so I had to catch up on the next day, which was a bit of a struggle.

In the long run, creating a beautiful presentation and being extremely thorough with our data were areas in which we exceled. Our time management could have been handled better, we found ourselves scrambling to finish the last slides right before we had to peer review. I thought that this project was a great learning experience because it taught me how to do many things, such as how to create a powerful presentation, collect data in an efficient way, organization, and staying focused while working hard.

Red and Blue: A study of Galaxies

Screen Shot 2018-08-15 at 6.23.04 PM

by Samuel Trusty

Presentations should be well organized, and luckily they normally are. The presentation I did about galaxies about an hour ago was one of those kinds. We were presenting about the colour of a galaxy affecting the local density, which is how close the galaxies are together. Our research for our project went well despite some problems, although we eventually reached a surprising conclusion that we couldn’t have predicted from the start.

The research question we had evolved over time but we concluded, “Does the colour of a galaxy effect its local density” our hypothesis was that younger blue galaxies would be closer together and older red galaxies would be farther apart because we thought that, like young stars, galaxies would form in clusters. Even when we got the answer to our first question it gave us more questions to look into.

Our research hit a few blocks. At first we just sorted the galaxies between colours and made local density histograms for them. We had our first problem when we couldn’t figure out what a large local density is since the range went into the negatives. We had a lot of summary stats that showed things like means and medians so we used the median as a threshold between small and large. We eventually figured out that we should be looking at standard deviation which shows how far from the average the data can be. It showed us that red galaxies had a high Standard deviation compared to blue. This was eventually distilled down to massive red elliptical galaxies which had a large local density.

This data disproved our first question but we wanted to know why, we figured out using R90 ArcSec, which shows how far away the galaxy is based on the amount of light it gives off, that there was a positive correlation between this and Log Mass, which is how massive the galaxies are. We concluded that the reason for the large amount of local density was because the red elliptical galaxies had more gravity and drew in other galaxies.

After all the research the presentation went better than what I would have thought. I remembered all the facts, and even included a few puns. My two partners in the project were very helpful and I think that they did really well in the research and presentation.  Even though we had problems going through the data we eventually figured out the numbers and raw data and refined it into a “stellar” presentation.

Zooniverse & Galaxy Zoo

by Joanna De Leon

      My group and I worked on Galaxy Zoo. Galaxy Zoo is astronomy based on data from the universe and scientists go in depth about information regarding galaxies. My group and I worked with two different types of galaxies, Spiral and Elliptical. We then constructed a hypothesis as we worked with the data from Galaxy Zoo. Our hypothesis was, “When the axial ratio of a galaxy is greater than or equal to 0.7, it will have a lower local density. When the axial ratio of a galaxy is less than 0.7 and greater than 0.2, the galaxy will have a higher local density”. After we agreed on our hypothesis we also constructed a research question that was, “Is there a correlation between the axial ratio and the local density of a galaxy? Does this differ based on whether the galaxy is an elliptical or spiral shape”. Based on this we then navigated ourselves with the data, we constructed graphs, filtered out data and made sure we were left with all the data that we needed. Based on our hypothesis and research question, we constructed graphs that did agreed towards what we had stated.

        While working with my group, I feel like I had a good and productive time, we divided all the work equally and we then shared out what we were most comfortable with. We made sure we understood the information that is being presented and we were also aware of time being consumed. I feel like my group also considered everyone’s ideas fairly and if we didn’t understand some type of information we made sure to ask. Some example of how we divided the work amongst our group was asking who was more comfortable with doing what. For example I did more of the background research while someone else would do data and then we filled each other with the information. Some problems that I faced were being able to filter out the data, my group also wanted to keep it concise and clear for the audience. Another problem I faced was memorizing the information. It was much more than just reading it because I wanted to understand it clearer and understand why it happened or why it didn’t.

     An overview of what we explored was data between Spiral and Elliptical galaxies, we wanted to understand if it mattered if the galaxie was round or an oval shape in a cluster. We classified the data between round ellipticals and oval ellipticals. We then did the exact same thing with spiral galaxies. How we gathered the data was by making is greater or equal than 0.7 this being the oval galaxy and the round  galaxy was greater than 2. Continuing we then concluded that it doesn’t really have a impact whether the galaxy is oval or round, since the universe does not have an end.

      Some things that went well was working with each other in a group we were always aware of what was going on and the information that we each gathered. We also worked well in constructing the project itself, and making sure who was saying what. Some things that could have gone better was gathering all the information we needed on time and being able to construct the graphs properly. After this project some information that I learned was knowing what a spiral and elliptical galaxy were and how different galaxies interact with each other. I also learned the different type of data between spiral and elliptical, and understanding that spirals are mostly red and ellipticals are mostly blue. In the end, I really enjoyed working with my group and we were all active team members.


Galaxy Zoo Project

by Samuel Rayas

Hi, my name is Sam and currently I’m a citizen scientist ambassador; furthermore I’m also going into my senior year at Nicholas Senn High School. To give a brief overview on what I’ve done so far can be explained as exploring the universe and stellar bodies and how they work. What I’ve just recently finished was my own (my teams) research question about the galaxies. How I came about asking this question was through getting the information from galaxy zoo. Galaxy zoo– for context– can be found in Zooniverse as one of their various projects. After looking at the data for a bit and seeing what we could do with it our group decided on what to explore.


Additionally, the question came to be “Does the color of a galaxy relate to the size of the galaxy?”. How we came about this question was by finding what was the most interesting aspect of the galaxy data. Vyreon and I specifically found both the size of the galaxy and the color of galaxy to be the most interesting thing to measure and explore. In the end we chose to combine the two finally construct our question. After the creation of our question we created our hypothesis which would be known as “Blue galaxies will be larger in size due to them containing blue stars which in turn are more luminous”. The blue galaxies would be larger in size than the red galaxies which contain red stars which are more dim. Our reasoning for this came from the HR Diagram since the blue galaxies turn out to be in the top left corner as they are more hot in temperature and brighter in luminosity.


Moving Forward, how we went about exploring this question was through separating the galaxies– both elliptical and spirals– into two color groups. After that we looked at the R90_Arcsec and found which galaxies fell under 10– which would be considered small galaxies– we also found the galaxies that went above 10– which would large– for both groups. In the end we found that the blue galaxies had a lot more smaller galaxies, while the red galaxies turned out to be larger in size. To reiterate, our hypothesis turned out to be wrong as the data proved the opposite; red galaxies were larger than blue galaxies. Lastly on this part our question was answered, there was a relationship between color and galaxy since blue galaxies tended to be small and red tended to be larger.


As a result, working in a group proved to be both challenging and as well interesting. My part in the beginning was to be more of a leader and also to communicate the groups interest into one. I think I did my part with making the data and also explaining what all the data meant to my peers. I think we went through a lot of trials, but I don’t believe anything is more satisfying than solving a challenging problem. Overall I think working in the team was a good experience since it was challenging, yet we pulled through with the project and it ended up really well. I think I wore my heart on my sleeve and so did my group so I don’t think there is nothing else to say; I appreciate their insight and criticism


Lastly, our group answered our question and even if we were disproven to be wrong I think it was worth it. I enjoyed the experience of learning with my teammates about the galaxies and what they entail. I liked the program overall and everything we did, but I won’t get sappy. I hope you got insight into my own scientific investigation and what our group did and a little about me.

Thanks for reading.

Space: The Final Frontier

by Zoe Heidenry 

Imagine being the first person on earth to ever see a certain galaxy. This happens quite often at Galaxy Zoo. Galaxy Zoo is a project found on the Zooniverse website. Citizen scientists are able to analyze thousands of images taken by the Sloan Digital Sky Survey. My group and I analyzed 20,000 data points taken from the project. Our research question is: “Does the color of a galaxy affect proximity to other galaxies?”

We know that the formation of stars occurs in multiples with the color blue signifying how young a star is. We wanted to see if galaxy formation and spatial distribution will  mimic star formation and spatial distribution. We hypothesized that blue galaxies will have a higher local density due to their young age. We tested a variable called local density, which measures how many neighbors a galaxy has nearby. We first filtered the data into red and blue galaxies, then tested the local density of both. We found that red galaxies are more locally dense than blue galaxies. This contradicts our hypothesis, and also answers our question. We could have stopped there, but this finding just created even more questions. We noticed that red galaxies had a really high standard deviation. Standard deviation is the variably of the data set, and explains how close data points were to the average. Basically, the higher the standard deviation, the more varied that data set is. We decided to split the red galaxy data based on two types: Ellipticals galaxies, which are usually old and look like a ball of light, and spiral galaxies, which are usually young and look like their name. We found that red elliptical galaxies had a higher local density than red spiral galaxies. Again, this finding opened up more questions. We knew from previous knowledge that elliptical galaxies vary in size, so we decided to test the local densities of big and small red ellipticals. We used the variable R90_ARCSEC,  which is a fancy way of saying size, and found that big red ellipticals have a way higher local density than small red ellipticals. At this point, we wanted to figure out why big red ellipticals have such a high local density. We theorized that since bigger things in space usually have more gravity, big red ellipticals must have a lot of gravity. We think that the big red ellipticals pulled other younger galaxies towards them. An analogy of this would be to think of a city. A city usually starts with one big building, and other new businesses slowly start to build around it.

My team really wanted to focus on communication. One of our goals at the start of this project was to make sure that everyone knew what was happening at all times. Space stuff can often be confusing, so it was essential that everyone understood the research that we were doing. We also wanted to create a safe and open environment for sharing ideas and confusion. I think that we accomplished these goals, because I feel like everyone had a deep understanding of all the graphs and statistics that were created. Our roles were not binary, we didn’t each do one set job. We were all creating graphs and running statistics. At first, this posed a challenge to us because we had so many graphs that we couldn’t quite make sense of them. But, after some discussion, we were able to focus on the parts that we needed, and discarded the excess. We answered our original question pretty quickly, but soon were faced with even more questions — what was so special about red ellipticals? I started running summary statistics (which give the average, range, and median of a data set) on a ton of different variables. I found that size had an affect on local density. I also helped with coming up with our theory of why big red ellipticals might be more locally dense.

Overall, I learned that science is not a linear process. It isn’t easy, and often involves finding something out that creates even more questions than what you started with. My group tested our data until we couldn’t test anymore. We worked well together, and made sure that everyone was on the same page at all times. I started this program with almost zero knowledge about galaxies and star formation. But, after taking the time to sit down and learn about it, I know now that space is not just some foreign and unreachable concept. Anyone can learn about space, regardless of previous education background. I encourage everyone to check out Galaxy Zoo on the Zooniverse, because you never know what discoveries can be made.

Our Galaxy Zoo Project

by Victoria Bruno

After 6 stressful and memorable weeks being in the Citizen Science Ambassadors we had finally reached our last project , Galaxy Zoo. And this was one of the best but most stressful projects I have done with my teammates. Knowing we had to present in front of many people brought a lot of second thoughts and fear to me, I have always struggled with talking in front of crowds as a kid I never liked the feeling. When it was our turn to present I had expected that I would have remembered what to say and when to say it, I had confidence but when it was my slide I had frozen up. I got scared. But luckily, I was able to have two other great team members to let me know to take my time and that everything was going just fine.

My role in the group was to explain the graphs and explain how we collected our data which was really easy to do . It’s just I let my fears and thoughts get in my way.  Today was emotional and a day I would never forget . I met so many people who I can say that they will forever be my best friends, We don’t live close near one another but the bond we had made is something that should and will always be kept. I couldn’t have asked for a better.

Where’s the Limit?

by Aarthi Koripelly

The Sloan Digital Sky Survey imaged over 600,000 galaxies using the Hubble. Our group used a data set containing 20,000 galaxies. More specifically, we took a look at the axial ratio and local density of the galaxies. The axial ratio of the galaxy is the ratio of the short radius of the galaxy to the longer radius of a galaxy. If the axial ratio of the galaxy is greater than or equal to 0.7, then the galaxy will be rounder. An axial ratio of 1 is a galaxy that is a perfect circle, meaning both the short and long radius are equal to each other. An axial ratio greater than 0.2 and less than 0.7 includes galaxies that are long or oval shaped. We filtered our data out with galaxies greater than 0.2 because when a galaxy has an axial ratio less than 0.2, the image is actually incorrect. This means that the galaxy is “edge-on” and the image was taken from a bad angle. Adding on, the local density is the number of galaxies in a galaxy cluster. Therefore, when the local density of a cluster is higher, the more galaxies would be in that cluster.

Our hypothesis stated that galaxies that are rounder (axial ratio >= 0.7) have a lower local density and galaxies that are more oval shaped (axial ratio > 0.2 & < 0.7) have a higher local density.

We came up with our hypothesis based on an analogy comparing cupcakes and brownies. Cupcakes are rounder like round galaxies, whereas brownies could be longer like oval galaxies. We first need to imagine that a brownie and a cupcake have the same volume. This way the brownie could be cut long and thin, whereas the cupcake would have a larger diameter. Therefore, we could fit more brownies side by side in a pan than cupcakes, if they are the same volume. We compared this theory to galaxies. We thought that if a rounder galaxy had a larger diameter than a longer galaxy, a rounder galaxy would take up more space in its galaxy cluster. Therefore, there would theoretically be less galaxies in a cluster with round galaxies.

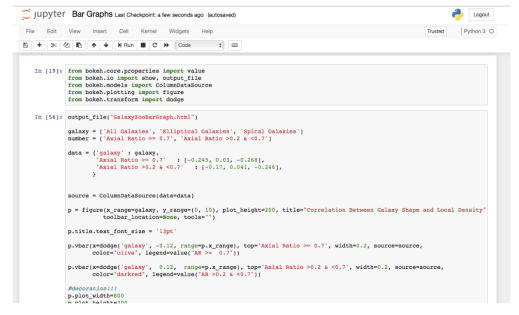
My role on the team was mainly using python programming for data analysis. I used Jupyter Notebook to create most of our bar graphs. A complication  that came up was trying to graph negative values as well. Many of the local density values are negative because they are in logarithmic form. Therefore, it took some trial and error for figuring the problem out. I used python (programming language) to code. The two most prominent packages I used were Bokeh and Matplotlib. Bokeh helps with data visualization and making the graphs look pretty, whereas Matplotlib helped with actually making the graphs. I also linked our code to the Github for anyone who wants to take a look at it. (Here is the link: https://github.com/AarthiKoripelly)

Screen Shot 2018-08-15 at 6.08.04 PM.png

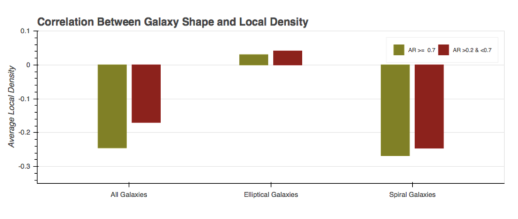
Based on our analysis, we found that our data did support our hypothesis. The average local density values were all higher for long, oval galaxies compared to round, circular galaxies. The graph below shows this in more detail:

Screen Shot 2018-08-15 at 6.08.19 PM.png

We were actually very surprised by the results. Initially, we thought maybe the data we would find would not support our hypothesis because space is infinite, so there couldn’t really be a bound to how large a galaxy cluster could be. Therefore, the axial ratios would be irrelevant to the density of the galaxy cluster. However, our hypothesis was supported. This final graph shows the average local densities all of our galaxies and also the spiral and elliptical galaxies separately. Some of the bars are upside down because they show negative values. In the future, we think it would be a great idea to research why this was the case and if our hypothesis could be supported by a larger set of data. We would also like to research is there is a limit to the size of galaxy clusters. After all, if there is a limit to how large a galaxy cluster can be, there could be a limit to the universe!

Galaxy Zoo

by Lauren Meier

From these past 6 weeks at the Adler Planetarium in the Citizen Science program, I have learned new information about astronomy and working in teams. For the final project on galaxy zoo, our group decided on the question ‘Does the color of a galaxy relate to the size of a galaxy?’ We hypothesized that the blue galaxies would be larger compared to the red galaxies  because of the stars the blue galaxies contain, which are brighter allowing the radius of light to increase.

We categorized the galaxies into two groups, the colors red and blue. We used R90_ARCSEC, a column measured in the document, to measure the size of the galaxies both small and large. We used the scale of less than and greater than 10 to categorize both the small and large galaxies, disregarding the fact that not all blue galaxies are spiral and red elliptical. After we found our data, we created pie charts in order to see the differences in percentages of the small and large galaxies for each color. We compared them to one another in order to reach a conclusion.

Our findings presented that our hypothesis was not supported and the red galaxies were larger than the blue galaxies. Some of the limiting factors that made our findings restricted was there were only 20,000 galaxies that were in the document. This made our results limited because only a specific amount of galaxies were considered in our data. With a greater amount of galaxies, the results may have been different.

After completing this project, I learned more about what galaxy zoo is and the importance it has at the Adler Planetarium. Hearing my peers present their projects also allowed for a new perspective on different questions, the process, and result.

Galaxy Zoo: A Star Experience

A Galaxy Zoo exploration was an enLIGHTening way to end the Citizen Science Ambassadors program. I was able to learn about astronomy and learn more about myself as a group member. My group and I constructed a question about the affects of color and proximity: Does color of a galaxy affect proximity to other galaxies? We hypothesized that “The formation of stars occurs in clusters or multiples with the blue color specifying how young a star is. Blue galaxies will be closer in proximity due to their ever-growing nature.” The construction of our question and hypothesis worked well and flowed — similar to that of our group.

Our group consisted of Samuel, Zoe, and I. We established strong group and personal goals from the beginning which is one of the reasons why our group collaborated effectively. We made sure we were all on the same page, we divided the work in the way that no one is overwhelmed or underwhelmed, and we made sure everyone’s voice was heard.We also divided up roles in a way that no one felt they weren’t doing work they weren’t comfortable with. I worked on some data evaluation and the presentation. I felt comfortable doing these tasks because although I wasn’t completely comfortable with making accurate assumptions with Galaxy Zoo data, I was able to translate the information we collected into slides for a presentation. However, the ride through our project and data collection didn’t run as smoothly.

During the beginning stages of our data collection, we struggled to find thresholds for local density in terms of big and small numbers. However, we discovered that local density was relative in terms of our building analogy we constructed and revised throughout our project. Galaxies form clusters as galaxies age and grow larger — similar to that of the construction of a city. Once we got over this hump of data collection, a lot of the data we gathered began to make sense and ran a lot smoother than the beginning. It also brought on the challenge of new questions and having new variables to look at such as Log Mass and R90 ArcSec. This taught me about the complexities of analyzing data and how reviewing it with a close eye was important. Not only that, but it enforced the idea that science is not a linear process.  

Overall, Galaxy Zoo taught me more about astronomy that I had not learned in school or anywhere else. It allowed me to apply what I learned in a hands-on manner that helped me grow as a citizen scientist and group member.

Galaxy Zoo: The Nature of Galaxies

By Vyeron John Parayno

This project is the very last project that we Citizen Science Ambassadors worked on. My group, Hubble’s Disciples, were enthusiastic about the way galaxies are sized and placed in the Universe. We also noticed, while exploring the Zooniverse website, that galaxies come in different shapes and sizes, and these are all tied to the colors of the galaxies. So, we decided to finalize our research question into whether or not color affects the size of galaxies present.

Our group knew that we only had a small sample of the overall galaxies in the universe(we had 20,000 galaxies to study). So, any findings and conclusions we come to shall not be brought into generalizations on every galaxy. We started our research using the Galaxy Zoo data provided to us by the Zooniverse team at Adler. We first analyzed which variables to manipulate and to measure. Our independent variable was the color of the galaxies: red and blue, and our dependent variable was the value of the R90_ARCSEC, also known as the radius of enclosed 90% light. We hypothesized that the blue galaxies will have the most numbers in the size of large because they have more younger stars which are in turn brighter, thus resulting in a larger radius of light.

We proceeded to the data collection by filtering out the red galaxies and the blue galaxies separately. In order to filter the red galaxies, we set the Zoo Tools values > 0.6, since red galaxies fall in that range. Meanwhile, the blue galaxy values were set < 0.6 since blue galaxies tend to fall in that range. In the end, our group found that there were 80.5% large Red galaxies and 19.5% small red galaxies. Meanwhile, there were 18.8% large galaxies, and 81.2% small galaxies.

To conclude, our hypothesis was not supported because our data turned out to have more large red galaxies rather than large blue galaxies.

In a bigger perspective, this project really brought light into the confusions most people have with galaxies. Galaxies will not always be blue, red, big, or small. Galaxies take their shapes due to different working factors. In this case, it would be the color and range of light. They also depend on the amount of stars they contain, and how old those stars are. So, there are a lot of factors that determine the size and shape of a galaxy.

Overall, our group learned more about the nature of galaxies as well as how classifications for galaxies work.