Count Flowers for Bees

by Alex Burr

Bees and other animals are pollinators, and pollinators are crucial to keeping plants, animals, and us alive. Without pollinators, we would be unable to grow 75% of the food grown in the US daily, including all the sweet fruits you love and all the bad vegetables your parents probably make you eat. For this reason, it is necessary to identify places pollinators can visit frequently in order to increase conservation efforts there.

Pollinators are broadly defined as any species that transfers pollen from one plant to another plant of the same species. Plants have both the pollen (analogous to sperm in males) and the stigma (analogous to an egg in females) needed to fertilize itself. While some plants are able to fertilize themselves without outside help, 80-90% of all flowering plant species cannot. They need another organism, a vector (like a bee), to transfer pollen to the stigma and fertilize the plant.

Count Flowers for Bees is a collection of photos of Ireland’s countryside, where there are many flowering plants that need vectors (aka cross-pollinating plants). The research team that took these photographs needs your help in counting the total number of each kind of flower in each picture. When you count these flowers, the research team is able to identify the areas most populated with cross-pollinating flowers that therefore need conservation efforts the most. Without these conservation efforts, humankind could lose many of the flowering plants and/or the vectors they need to create food. This project is important because it concerns the very pollinators we all need to create the majority of our food, and without food humankind cannot survive (we think).  

Radio Galaxy Zoo and Black Holes

by Maritza Hernandez (a 2016 Adler Astro-Journalist)

Black holes are always found in the center of galaxies and we need help to discover them. There are two ways to find a black hole. One way to find a black hole would be by their gravitational influence. For example, we could find stars rotating around a black hole. The second way to find a black hole would be observing matter falling into the black hole. The more massive galaxies have bigger black holes in them, and generally the bigger the black hole is, the easier it is to locate. Bigger (more massive) black holes can eat more matter, and when a black hole eats matter it can create jets of material and those jets can travel close to the speed of light. You can detect these jets of material by a radio telescope than we can guess the location of the black hole.

On the Radio Galaxy Zoo site, they combine radio images with infrared images to find these black holes and their jets. Most of the radio images come from the Faint Images of the Radio Sky Twenty- Centimeters or for short FIRST, but also they come from the Very Large Array (aka VLA) telescope in New Mexico. The infrared images come from the Wide-Field Infrared Survey Explorer (aka WISE) and also the Spitzer Space Telescope. Radio images comes from the jets and the infrared comes from galaxies. Infrared is the color that dust glows bright in and of course galaxies have a lot of dust. Radio Galaxy Zoo needs your help to line up the images of the jets with the galaxies to help you to find a complete black hole system. But make sure that the jets look like they are coming from the black hole/galaxy.

We need your help to find these black holes! The Radio Galaxy Zoo team hopes that you can help astronomers learn how black holes are formed, how they are found, and much more. They try to use computers to find these black holes and their material jets. But what if the computers can’t do the job? Well, it’s hard for the computers to tell whether the jets are coming from a certain galaxy. Some other reasons that they want to find black holes are that we want to know what goes on inside of a black hole and why is it that time is affected by the black hole. We also want to know what role a black hole plays in unfolding the universe.

Planet Four: Terrains!

by Kristian Marinez (a 2016 Adler Astro-Journalist)

The goal of the project, Planet Four: Terrains, is to have citizen scientists (average people who probably don’t work in the field of science) review the terrain of the South Pole of the 4th planet in the Solar System, Mars. The terrain is usually formed by the melting of CO2 and ice in the polar ice caps during summer and spring. The images reviewed by the citizen scientists come from Context Camera aboard the Mars Reconnaissance Orbiter. In other words , the images come from a camera that takes pictures of Mars’ terrain from orbit. With the feedback citizen scientists give back, the team will send out the HiRISE (the highest resolution camera ever sent out into space) to new interesting areas of Mars to analyze and see how the terrain changes over time. But features of the terrain are being studied? In the Martian terrain, we can find “Spiders”/“Baby Spiders” and the “Swiss Cheese Terrain”.

KristianP1f1
Examples of Spiders and Baby Spiders – Image Credit:NASA/JPL-Caltech/Malin Space Science System , taken from the Planet Four Terrains Research Page

KristianP1F2
Example diagram of how spiders are formed, original figure from Piqueux et al., 2003, taken from the Planet Four Terrains Research Page

Spiders (not real arachnids, just terrain that has an image like spiders) is just a name for shallow, patternized channels (passages) on the surface of Mars. These channels are several meters deep and vary in size concerning width. Spiders form when dry ice (carbon dioxide ice) forms in the South Pole. When the Spring season come around, sunlight penetrates the ground, causing the ice to turn into gas from the bottom up. The gas then gets trapped in a layer of ice. When a crack forms in the terrain, the gas erupts out of the opening and also carries loose materials out. Finally, when Summer comes around, the CO2 evaporates and the material on the ground is no longer visible. This happens again in the Autumn and slowly erodes channels in the ground, which are the spiders. The actual term for Spiders is araneiform. Baby Spiders are just the beginning features of the spiders.

The Swiss Cheese Terrain are curvy pits in the surface of thin layers of CO2 ice. Basically, Swiss Cheese Terrain pops up because of repeated cycles of condensation (gas to liquid) and sublimation (solid to gas without going through the liquid stage) of CO2. Thin layers of CO2 ice deposit in excess amounts on some areas. The ice sublimes (solid changed to vapor when heated) and a new layer appears. Areas with no sunlight accumulate CO2 while areas with sunlight lose CO2. This causes irregularities in the terrain. Eventually, pits appear in the CO2 layer. The pits absorb a large quantity of CO2 and they grow.

After a lot of scientific explanations and what not, the goal of Planet Four: Terrain is pretty simple: it’s to give back feedback on the images of the terrain of the South Pole in Mars to analyze and notice how the terrain changes over time.

To learn more, check out the Planet Four: Terrain Blog :).

Disk Detective

by Maddie Meagher (a 2016 Adler Astro-Journalist)

Trying to find planets forming around stars can be quite a daunting task even with the best technology available. This is where a Zooniverse citizen science project called Disk Detective comes in. It’s main goal is to find planets around other stars as well as finding planets in the process of forming. Currently we know very little about how exactly planet formation takes place. What we do know is that planets form around their parent stars in rotating vast gigantic disks, made of various gases and large chunks of rock. What we’re looking for in Disk Detective are two of kinds disks, and both types of these disks are the signposts of the planet forming process.

MaddieP1f1 YSO disk
Maddiep1f2 Debris Disk                          

The data for Disk Detective comes from a survey from a NASA satellite mission called WISE (Wide-Field Infrared Survey Explorer). From 2010 to 2011 WISE created maps of the night sky in infrared wavelengths to look for theses disks. As stars with disks around them shine brightly infrared light due the dust in the disks, where a star all by it’s lonesome wouldn’t shine bright in infrared at all. The two major disks astronomers were looking for in these maps are YSO and Debris disks. YSOs have disks mostly made of gas where planets like Jupiter and Saturn can form. These disks are often less than 5 million years old and will tend to form in clusters. In the picture above for the YSO disk (HL Tauri) you can see where planets in development have begun to clear their orbits around their parent star. Seen by the empty bands in the disk.

On the other hand, Debris disks tend to resemble the Kuiper belt in our own solar system, however, on a more massive scale. A Debris disk’s age tends to be about 5 million years and older. They tend to be composed of more rocky and icy materials and they usually orbit around older stars. Rocky planets like Earth are believed to form out these disks by dust moats gathering around a star to form rocks. Collisions of the larger rocky objects eventually snowball in a rocky planet like Earth, Venus, or Mars!

MaddieP1f3
Image: Distribution of infrared brightnesses (x-axis) for a sample of 84 stars. While most stars cluster around 1, a lot of the stars have a higher amount of infrared emission (further to the right on the x-axis). Stars with planets are shaded as dark gray, while stars without known planets are shaded with light gray. Although stars with known planets make up less than a third of the sample, four of the five stars with the highest infrared brightness have known planets.
Citation: Beichman et al.2005 Astrophysical journal 622: 1160-1170

Keep in mind, in the graph above stars with disks like HL Tauri are most likely not counted in stars with known planet category. As the bands you saw in the picture above are only indirect evidence of planets residing there.

While WISE has taken Thousands of pictures of the night sky to create the most powerful survey for dusty disks ever known, it does not change the fact stars surrounded by a disk can be rather difficult to spot. Stars with a disk aren’t the only objects in the night sky that glow bright in the infrared (ex: galaxies,asteroids,active galaxy nuclei). Even computer algorithms designed to automatically search for these disks are easily thrown off by these sources of confusion. This is why there is a need for citizen scientists to help classify these objects. So that we can make sure that what we’re really looking at stars with disks. Finding these disks and the birthplaces of planets has been a major quest of astronomers for the last three decades. So start classifying and make new discoveries!

Sources:

Disk Detective Tutorial
http://iopscience.iop.org/article/10.1086/428115/pdf
http://www.jpl.nasa.gov/news/news.php?release=2014-032
http://www.space.com/450-planets-form-mess.html
http://www.centauri-dreams.org/?p=301
http://www.spitzer.caltech.edu/images/2660-ssc2004-22b-Planets-Point-to-Dust

Spectral Energy Distributions (SEDs)

Jungle Rhythms!

 by Ronnie Ovando (a 2016 Adler Astro-Journalist)

When stepping through the Zooniverse citizen science project “Jungle Rhythms,” it feels as if one is playing a Nancy Drew or Sherlock video game. The project contains a bunch of old documents relating to tree life cycles between the 1930’s – 1950’s. The goal is to be able to interpret the hand written documents that have lost their color due to old age. The documents are designed to be like calendars, to be labeled according to what happened that particular year to the tree. The video game-like challenge comes from having to be detail-oriented in order to understand and catch the little markings with the documents.

The African rainforest is said to “store up to 66 Pg (Picograms) of carbon,” according to the project’s home page. Scientists at Jungle Rhythms are concerned for how this will affect or effect climate change, and how exactly weather conditions can alter the forest. For example, droughts can severely affect structure and function. By using the documents and knowledge of the rainforest’s weather history, the participants can possibly figure out how trees react to weather.

How did the Jungle Rhythms scientists collect this documented history of tree cycles? Between 1937 and 1958, researchers at Yangambi research station studied over 2000 trees. They all recorded data that dealt with life cycles (also known as phenology) such as fruit development, leaf growing, etc. The data was organized in calendar-like tables, which have sections that are separated into years. The original copies were made digital in order to translate without ruining the hand written documents.

Transcribing the documents seems like a job only for scientists, but the skills needed for this task are common. The home page states “The human eye and brain is finely tuned to finding patterns and picking up these slight nuances in shading.” Essentially, our brains are wired to do this! In order be a successful citizen scientist, one also must have a good base in knowledge of the trees in the African rainforest in order to understand the context of the data.

RonneP1F1
“A Summary Table” – Jungle Rhythms


The picture above is an example of how the documents look and are organized. It’s almost calendar-like, expect with listing years instead of just months. Each section listed is divided by 6 months, and at the far left are the names of the trees being recorded. Within those sections, data is represented by lines, crosses, or other types of marks. Very few words are used.

RonneP1F2
“Tombe Writing – Jungle Rhythms”

Here’s a good example of writing within one of the tables. The writing above reads “Tombe,” which according to Google Translate, means “falls” in French. It can be concluded then that the tree fell sometimes this year. The time when is hard to interpret. For me, I assume that the fact that no month is emphasized in the picture, that the scientists did not know the exact month the tree fell, but concluded that it fell between March – August.

For people who are interested in both science and history, this Zooniverse project does a great job and attending to those two fields. Jungle Rhythms is hoping to discover new data concerning African trees, and the interpretation of the documents.

Galaxy Zoo: Classifying Galaxies

By Jenny Moore (a 2016 Adler Astro-Journalist)

Galaxy Zoo is a civil science project that teaches people about the different types of galaxies in the universe. There are ones with smooth edges, or swirl patterns, or ones that have undefined shapes. There can also be unusual qualities in the image of a galaxy, such as an odd pattern, or large center bulge. This project also teaches civilians that each galaxy is slightly different, just like a fingerprint! Throughout the project, one can discover how galaxies are formed, and what the astronomers connected with the project are trying to understand. Galaxy Zoo’s goal is to study different galaxies and understand how the formation of galaxies affects the universe around us. Over time, the interactive galaxy classifying ‘game’ has matured from just identifying the galaxy’s shape, to identifying its key features, and even using images from special cameras that measure dark energy!

JennyP1F2 Figure 1: Above you can see different examples of galaxies and the different shapes they come in.


This project has evolved and each stage gradually gets more complex for the civil scientists. Galaxy Zoo started with images collected from the Sloan Digital Sky Survey, which created the most detailed 3D map of the universe. When the project began, it asked civilians to complete much simpler tasks. All one had to do was classify the shape of the Galaxy. The second stage of the project called for a more precise description of each image. It asked civilians to describe the arms of spiral galaxies, the size of their center bulges, etc. The third stage drew imaged from the Hubble telescope as well as the SDSS. Recently, scientists have combined the images from the Hubble surveys and the SDSS to create the most detailed imaged possible.


This project now uses images from the Dark Energy Camera Legacy (DECal) Survey, in addition to using the Hubble and SDS surveys. These cameras are the most sensitive and widest cameras used in the process of collecting images for this project. Since these camera’s are so sensitive, they produce images that are much clearer and more defined than the SDSS or Hubble surveys ever did, as shown in the image below. Galaxy Zoo has begun using these images to get the most accurate results in their study. Dark Energy Camera’s are used to not only make the clearest images of the universe, but they also measure dark energy.  Dark matter, and dark energy, make up a large portion of our universe. The DECaL survey uses infrared technology to create a map of our universe. The Dark Energy Camera Legacy Survey’s main focus is to collect the brightest images of faraway galaxies that cannot be seen with the naked eye. This survey is creating a layout of the universe by combining images of the night sky at different points in Earth’s rotation. The DECaLS project got me thinking about dark energy, because another aspect of this ‘map’ DECaLS is creating, is measuring the amount of dark matter and energy the universe is made of. I, personally, find this quite amazing because dark energy is a mystery to astrophysicists. It makes up over half of the universe, and yet no one knows what it is or where it comes from!

JennyP1F1 Figure 2: On the left is an image from the SDSS survey, and on the right is an image from the DECal survey. Both images are of the same galaxy.

Through the Galaxy Zoo project, civilians are helping scientist further understand the universe around us. By using clarified images from the DECaL survey, the scientist behind Galaxy Zoo can get the most accurate classifications from civilian’s submissions.  The classifying galaxy ‘game’ is helping categorize images of certain types of galaxies, and also figure out where large amounts of dark energy are. The clearer the images are, the more precise the classifications are. So get out there and start classifying!

Image sources:

Figure 1: http://blog.galaxyzoo.org/2012/09/

Figure2: http://blog.galaxyzoo.org/2015/09/21/new-images-for-galaxy-zoo-part-1-decals/

New images for Galaxy Zoo! Part 1 – DECaLS

Asteroid Zoo

By David Torrejon (a 2016 Adler-AstroJournalist)

As I came upon the Zooniverse website, I discovered Asteroid Zoo. This project aims to explain asteroids, which are small rocky bodies that orbit the Sun. This project provides a basic introduction to asteroids, such as the classification of asteroids, but more importantly, enables the search for new asteroids. In fact, astronomers are detecting more and more asteroids every year.

DavidP1fig1from http://neo.jpl.nasa.gov/news/news189.html

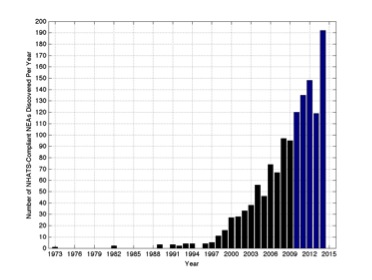
As can be seen from the graph, the year appears on the X-axis and the number of new Near-Earth asteroids detected is displayed on the Y-axis. The number of detected Near Earth Objects have skyrocketed every year since 2000. In 2000 there were roughly twenty however, in 2015, there was roughly 190 probably because of the advancement of technology over the years. You may ask yourself, why detect asteroids? What’s so important about discovering irregularly shaped rocks?  But I’m here to explain the importance of asteroids.

Astronomers have found asteroids quite intriguing and important because of all the information the asteroids reveal about the solar system. The deputy principal investigator for NASA’s DAWN mission, Carol Raymond, said “The materials in asteroids represent the building blocks of the planets. ” I agree with Carol because asteroids are the earliest remains of the formation of the Solar System. They are the basic leftovers debris from the Solar System. They could potentially reveal valuable information about the emergence of the Earth or other planets.

Besides revealing important information, asteroids could be corralled and mined to provide an abundant supply of raw materials. Asteroids have been known to have Platinum Group Metals, which are some of the rarest and most valuable elements. These elements are found in the center of the Earth and cannot naturally grow in the Earth’s crust. In other words, these elements will most likely not be found in the Earth. Asteroids should been mined for their resources to address one of the Earth’s main issues, which is resource scarcity. Not only would the mining provide the Earth with resources, but it would help reduce the exploitation of Earth resources. The demand for asteroid material can lead to a resource driven economic expansionism, which can lead to the development of new innovations.

Lastly, determining the location of asteroids is very crucial for our survival. There are approximately 10,000 Near-Earth Objects (NEOs). It is possible that one day, one of these 10,000 asteroids could enter the earth’s orbit and could potentially strike the Earth, killing nearly all of the species on Earth. Recently in Chelyabinsk, Russia on February 15, 2013, an asteroid roughly 17 meters in diameter and traveling at 42,000 mph detonated in midair. The explosions released energy equivalent to 500 kilotons of TNT. The explosions injured 1,500 people and damaged property. Some people experienced retinal and skin burns. This is why determining the location of asteroids is very important, to prevent the human race from suffering the same fate as the dinosaurs. Now there is no need to worry. The odds of an asteroids striking the Earth are slim. However, if an asteroid is headed our way, we need to be aware of the asteroids.

To sum it up, asteroids play an essential role in the survival of the human race. By continuing to use telescopes to look out for NEOs, this will help us avoid an asteroid collision with the Earth. Asteroids could potentially reveal more information about the formation of our Solar System. Plus, people could take advantage of the surplus amounts of asteroids to mine for raw and scarce metals.


Bibliography
“The Asteroid Hunters.” Popular Mechanics. 2015. Web. 10 Mar. 2016.
“5 Reasons to Care About Asteroids.” Space.com. Web. 10 Mar. 2016.

Summer at the Adler Planetarum

This has been a great experience for me. I was able to learn a lot and meet new people. This also helped me learn to socialize more and better with others. With this I was able to work well with me two partners and friends J’Mari and Miguel on a project that interested us all in the end. The project we worked on was the Milky Way Project in which had revolved around the topic of bubbles. The reason I have chosen this project is because I have a good interest in space and galaxies, it looked a bit more interesting than the others, and I had a lot of questions about this topic.

The tools we used on this project were iPython Notebook, Wix.com, and Code Academy. iPython Notebook is one tool we used to complete are plots and analyze data by coding in a language known as Python in order to do certain tasks. We used Wix.com to build our website in which we can post our data and share it with the world. And we used Code Academy to help us with the basics of coding and Python.

I did make a few discoveries in the process. There were a lot of things that I was not aware of, or did not know about at the beginning that I do know about now, such as, what “bubbles” are. From the start of this program I had absolutely no idea of what a bubble in space was, but now I can say that bubbles are primary star forming, or birth region composed of partials and gasses.

Some things I really found interesting was how the plots turned out in the end, which areas had more bubbles than others, and the things you can do and accomplish using coding and Python. The plots showed a wide range of bubbles and their position, and in one case their size. This was quite amazing because it added a different perspective to the question and our mindset. The plots also had shown a variation in population of bubbles in certain areas.

Bubbles Plot

This one of the plots we made that was really important to our research and finding the answer to our question; although, we are yet to have found an answer to your question.

Some questions I would try to answer if given the chance or time to are: What is the relationship, or what are some similarities between various bubbles and their area (if there is any), how does the area where the bubbles are located affect the amount of bubbles found in that area, if bubbles with stars of different classes were to combine, what would be the outcome?

J'Khai

My name is J’khai Walters and a I am an After School Matters apprentice here at the Adler. I am also a junior in high school and this my first time ever doing something like this and I have to say that I really enjoyed it here.

Here is the link to my website: http://waltersjkhai.wix.com/milkywayprojectjmj

Star Clusters

My name is Stephan T. and I am a rising senior at Kelly high school. I am a part of ASM’s Adler Citizen science ambassadors and our group focused on the Milky Way galaxy project and open star clusters. Our website can be found here: http://stsang6.wix.com/milkygalaxy

One interesting thing I learned from the project was that star clusters actually get smaller over time, rather than expanding as it gets older. This only applies to open star clusters. If given the chance, I would like to study what happens to globular star clusters (the opposite of an open star cluster) as they age. I am curious whether or not they will become smaller in diameter like open star clusters, or actually become bigger in diameter.

Star Cluster Age vs Diameter

Throughout this project, there were many fun and new experiences as well as some new and challenging obstacles. Some fun experiences I had were working with new people, learning about new topics and trying to understand them. There were also some tough and challenging obstacles to overcome throughout the program. It was challenging trying to learn python and implementing what we learn into our project. Not to mention how tough it was trying to understand scientific papers and topic other scientists had written before.

One very fun new experience I had during the project was working with new people and learning new topics. If I were working on this project by myself, I do not think that I would have enjoyed it as much because there would not be anyone to bounce ideas off of. By having my group members however, I was able to learn and look at these topics from different perspectives. I also love solving problems. While we were working on codecademy, I came across many problems and code related issues during the course. It was tough trying to solve them but it was also a very fun and rewarding experience.

There were some tough and challenging aspects of this project. The first challenging part of this project was understanding the science behind the Milky Way Galaxy project. We read papers written by researchers about star clusters, star forming regions, and a whole bunch of information related to them. It was a lot of information to take in at first, but we were able to slowly understand what the research papers were about. The second challenging aspect of the project was the coding part. The basics of python were pretty simple, but as soon as we jumped into plotting the data and formatting it, things got a bit complicated and it was harder to understand some of the topics the scientists were talking about. It took some time, but our group was able to successfully input and program all the data we had on star clusters into a nice graph and table to present to others.

Line of Best Fit

Before attending this program, I never would have thought much about stars or star clusters and how interesting they were. I recommend that anyone interested in astronomy and coding apply and take part of this program because of how engaging and fun the experience is.

Citizen Science Ambassadors: The Best Summer Experience Ever

If I were asked what I remember the most about the summer of 2015, I would easily say all of the hard work I’ve done this summer. Now, I have two reasons for working hard, but the one that stands out the most is the work I’ve done as a Citizen Science Ambassador. I had the opportunity to make new friends, discover a world I have never known and explore the Adler Planetarium like I have not done before. While any other teenager’s summer vacation would be dedicated to being lazy, my partner and I’s were dedicated to a project that we are very proud of and would love to have the opportunity to do it again.

This summer I had the opportunity to analyze a project from Zooniverse, a website that filled with projects that scientist do not have the time to go through and analyze themselves, so they leave it up to citizens all over the world to do this for them. The Zooniverse project I had the experience of analyzing this summer was Snapshot Serengeti. My main reason of choosing this project is because I love to learn about wildlife animals, and while the other Zooniverse projects- The Milky Way Project and Galaxy Zoo- were interesting, Snapshot Serengeti captured my interest more. I liked the fact that with Snapshot Serengeti I was able to basically track animals and that just from pictures, scientist all over are able to track the eating habits and migration habits of each animal that is captured on camera. They are able to see how frequently each animal visit the spot, during what times of the year and how many goes to that certain spot at a time. In the end I also chose this project because the questions that I came up with for this zooniverse project seemed more interesting to look into than the questions I came up with for the other two projects.

In order to answer my research question I needed to learn new skills, and these skills will be able to help me with any other experience I have that will be similar to this one. First I had to learn how to code, which I used Code Academy to help with that. My experience with Code Academy is better than any other tool I have used to answer my question. By using Code Academy I was able to learn how to code different functions, list, plots and dictionaries that helped me preform the actions I needed to take to create the plot for my question. I also had to learn how to use iPython Notebook. I did not like learning how to use this program very much, only because it was a lot harder to learn this program than Code Academy. I am, however, proud of how much I learned using this program. When I stated using this program I felt insecure about my abilities to code, but after I created the plot for my research question, I felt confident with my coding abilities.

Code

An example of code we used

While working on this project I have made many exciting discoveries. Throughout this project I had learned a lot about the migration patterns of the lions and zebras. I was able to learn about the how often each animal moved and what each animal ate. This allowed me to be able to figure out if these two animals will be in the same place at the same time and if their migration patterns are affected by what they eat. It was fun discovering different codes for functions that were able to help me create plots and other charts in order to answer my research question. It was also fun discovering, after the plot was made, that the animals were in the same location.

Plot

Some questions I still have after all of this is: Were the zebras and lions there at the same exact date or were they just captured there on the same camera? And are there any other plots we could make that would express our answer to the question? If I were able to expand my project I would create more charts that go in depth of each month and location of the animals and if any of them were in the exact same place at the exact same time.

Here’s a link to the website my partner and I have made: Snapshot Serengeti Project


Keyaira

My name is Keyaira Taylor and I like to play softball, listen to music, read, eat, write and sleep. I like to watch tv in my free time. I want to go to Ball State University or University of Illinois to study early childhood education.